


Next: Integral Channel Feature Descriptor Up: Descriptors Previous: Haar Features
|
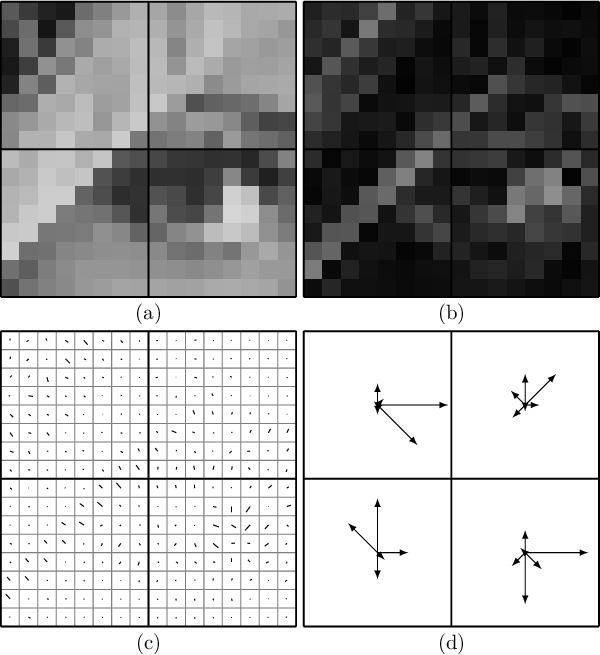
The Histogram of Oriented Gradients (HOG) is one of the most successful techniques in recent years for effectively describing a region. It was first used successfully in SIFT to describe keypoints, and in combination with SVMs to produce high-performance classifiers (DT05).
Given the window from which the descriptor is to be extracted, the magnitude and phase of a gradient operator (a derivative filter, such as Sobel, or any other operator) are computed at every point.
The phase is then quantized:
typically, 6 to 9 bins are used, and the phase may optionally be computed with a period of  , thereby ignoring the sign of the gradient.
HOG is based on two ideas: using the gradient phase to obtain a compact descriptor that is highly invariant to brightness, and dividing the window into subregions called cells, which may overlap and can have any shape or size. Although HOG cells are usually square, R-HOG uses rectangular cells, while C-HOG uses circular ones.
A gradient magnitude histogram is extracted from each subregion of the image to form part of the descriptor. The most widely used HOG variants locally normalize brightness and contrast. To do this, neighboring cells are grouped into blocks. A normalization factor is computed for each block and used to adjust the weight of each cell within it.
The histogram bins for each cell into which the region is divided make up the descriptor, which is used to compare points or to train object recognition systems.
Paolo medici