Next: Integral Channel Descriptor Up: Descriptors Previous: Haar Features
 |
The Histogram of Oriented Gradient (HOG) is one of the techniques that has recently achieved significant success in effectively describing an area. This method was successfully used for the first time in SIFT to describe feature points and, in conjunction with SVM, to obtain highly performant classifiers (DT05).
Given the window within which to extract the descriptor, the magnitude and phase of a gradient operator (a derivative filter, Sobel, or any other) are calculated for each point. The extracted phase is then quantized: typically, between 6 to 9 bins are computed, and optionally, the phase is calculated with periodicity  , thereby ignoring the sign of the gradient.
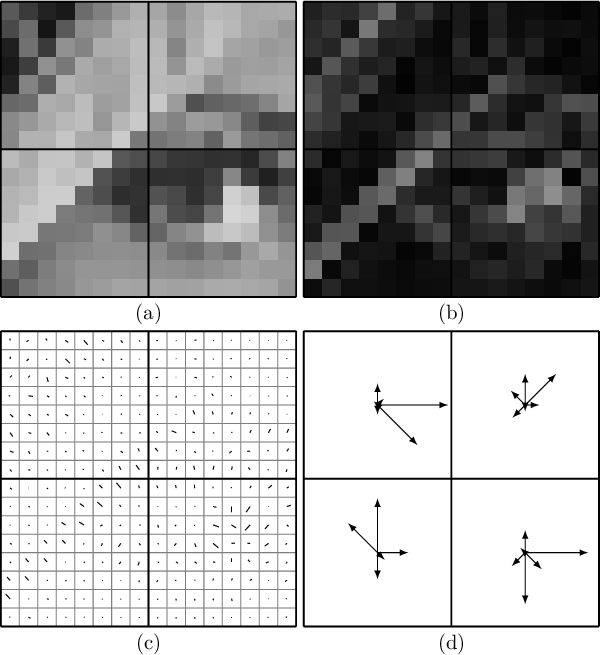
The ideas underlying HOG are both to utilize the gradient phase to obtain a compact yet strongly illumination-invariant descriptor, and to decompose the window under examination into subparts, called cells, which may be overlapping and potentially of any shape and size. While HOG cells are typically square, it is possible to find rectangular cells in R-HOG or circular cells in C-HOG.
From each subpart into which the image is divided, a descriptor piece is extracted, formed by the histogram of the gradient magnitude. The most commonly used versions of HOG aim to locally normalize brightness and contrast. To achieve this, spatially adjacent cells are grouped into blocks. For each block, a normalization factor is extracted, which is used to adjust the weight of each sub-cell.
The histogram bin for each cell into which the area is divided represents the descriptor, a descriptor to be used for point comparisons or in training for object recognition.
Paolo medici