


Next: Minima and Maxima in Up: Sub-Pixel Accuracy Previous: Sub-Pixel Accuracy
|
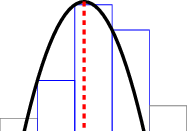
If the point under examination is the maximum or minimum of a one-dimensional sequence, its immediate neighborhood can be approximated by a quadratic function of equation
 .
The quadratic is the lowest-degree function that permits the localization of local minima or maxima.
.
The quadratic is the lowest-degree function that permits the localization of local minima or maxima.
Let  ,
,  , and
, and  therefore be the function values at offsets
  ,
,  , and
, and  from the minimum/maximum located with pixel-level precision.
The equation of the quadratic passing through these three points takes the notable form
from the minimum/maximum located with pixel-level precision.
The equation of the quadratic passing through these three points takes the notable form
 |
(1.131) |
 |
(1.132) |
 is to be understood as the offset from the previously identified maximum/minimum, that is, it represents only its sub-pixel component.
This equation also provides another notable result: if is a local maximum/minimum, then by definition this value is always less/greater than both and .
From this observation, it follows easily that
always lies between  and
and  .
.
There is an alternative formulation: denoting by
 and
and
 , the equation of the parabola becomes
 |
(1.133) |
 |
(1.134) |
and depends only on the deltas.
Paolo medici